
A Startup Financial Model for the AI Inference Era
Thesis
An AI startup's financial model needs one new sheet and one old discipline: the AI cost stack as brackets, and spend gated by Customer Development evidence gathered from real customers.
A core part of the AI boom we are seeing is the resurgence of entrepreneurship and the exponential growth paths some new startups are hitting.
While we have seen these types of startup booms in the past - The Dot-Com Bubble of the late 90s, the Social Media era of the 2000s, the SaaS boom in the 2010s, and so on - what makes this one different is that the majority of these companies are now powered by AI models.
And thus the core thesis of the post, which is that any financial model needs a mix of old and new: the old is the discipline for running the business by gating the spend around Customer Development; the new is a new sheet that maps out the AI cost stack as brackets.
Where the Old Startup Financial Model Falls Short …
The typical SaaS company in the 2010s reached 80 - 90% margins and used retention as the moat, with near zero marginal cost on the back-end. Inference is itself a significant marginal cost - a16z's 20 - 40% of revenue on inference (2023) and ICONIQ's ~23% of AI product costs (2026).
What does that mean functionally to the average business model?
It means that margins fall from 80 - 90% in the typical SaaS business model to 50 - 60%. Iconiq's 2026 'The Execution Era of AI' report cited gross margins as 52% on average.
In the AI App Layer Thesis, I looked at how the interplay between frontier labs and the companies who build on them are evolving. Currently, we see many billion dollar companies scaling-up at record speed, typically in very specific verticals such as law (Harvey) or enterprise agents (Glean). The labs themselves continue to test this thesis on the other side by launching their own 'apps' horizontally, with one recent example being the release of Claude Commerce Agents.
In the middle of the barbell - between those seeing record-breaking growth as either a top app layer company or the frontier labs - are those companies who are failing to reach breakout levels of growth and are failing at the business level.
What the new reality of AI business models requires - given the thinner margins and higher COGS - is rapid growth. Thus we need to be able to model out the various assumptions of the business and associated costs in the AI Stack to get a clear picture of the probabilities of success.
How The Model Is Built
Reference Model and Research
As a reference, the original Startup Financial Model was released several years ago to show the basics of financial modelling. Customer Development was created by Steve Blank to break down expectations of startup customer acquisition into phased gates: Discovery, Validation, Creation, and Company Building
A more detailed explanation of Customer Development can be seen in a previous post. The way corresponding financial resources are modelled and deployed in this version of the AI Startup Financial Model are directly related to the Customer Development framework.
- 0_Narrative - Mapping the narrative relative to the Pitch Deck, and selecting the set of Assumptions relative to the model: Base, Upside, Downside
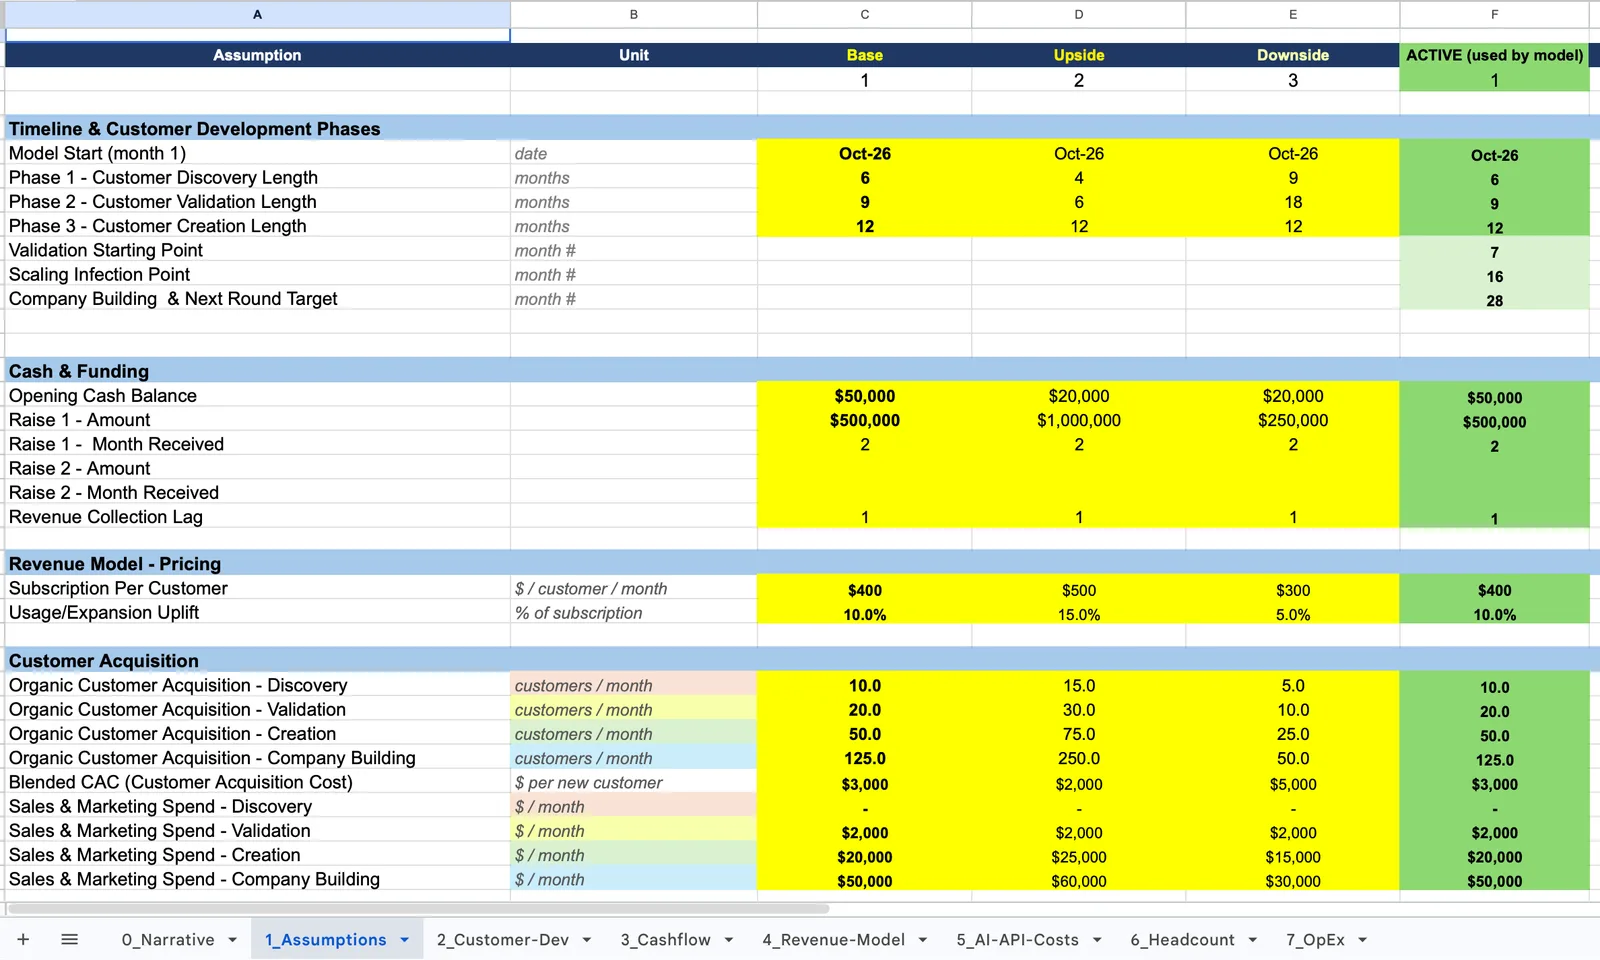
- 1_Assumptions - setting the Assumptions for the whole model related to Customer Development timeline, Cash and Funding, Revenue Model, Costs etc - Base, Upside and Downside
- 2_Customer-Dev - the Customer Development timeline applied to the model: establish the baseline for Customer Discovery, Customer Validation, Customer Creation, and Company Building for the model
- 3_Cashflow - aggregate view of Cashflow for the model, along with estimated runway and time to cash positive
- 4_Revenue-Model - core revenue and pricing model for the business
- 5_AI-API-Costs - five key line items around AI and API costs: (L1) Model Inference, LLM calls in the core product (L2) Other third-party APIs (L3) Hosting and Cloud (L4) AI Dev Tooling: Claude Code, OpenAI Codex, etc. (L5) AI Tools for Non-Engineering Staff. There are then Light, Medium, and Heavy brackets for each line item, creating a bracketed range for modelling purposes.
- 6_Headcount - core assumptions around Headcount and hiring for the business, along with when those key hires would presumably be made within the Customer Development lifecycle
- 7_OpEx - itemized list of major Operating Expenses for the business
The Spending Gates - Customer Development as the Model's Spine
(2_Customer-Dev as reference)
If you think about the average startup on a cashflow continuum, it becomes clear that the main goal in the early stages of business model exploration and validation is staying alive. Managing cashflow is paramount and most founders dramatically underestimate the time it takes to hit expectations, typically by about 3X.
The quickest way to kill a startup is to overhire too early, especially mid and senior-level executives who are accustomed to high pay packages in the corporate world.
The model takes these known variables into account and gates spending around them using the Customer Development framework:
- Discovery: 6 Months (Month 1 - 6) - prototype-level usage, no S&M program
- Validation: 9 Months (Month 7 - 15) - small-scale spend on S&M, seeing first paid customers, test pricing model and assess margins for sustainability
- Creation: 12 Months (Month 16 - 27) - major S&M hires, scale-up growth
- Company Building: Months 28+ - build out of the company, larger-scale fundraising and expansion plans
| Phase | Spend posture | Gate to next phase (evidence) | Model behaviour |
|---|---|---|---|
| 1 Customer Discovery | Founders & minimal build; no Sales & Marketing (S&M) program; prototype-level usage. | Problem/solution fit: design partners say they would pay; a first paid pilot. | Only phase-1 roles are hired; hosting/tooling at floor levels. |
| 2 Customer Validation | Small, instrumented spend; first paid customers; test pricing & routing. | Repeatable sale + contribution margin per customer > 0 + 6-month cohort retention above the guard. | Phase-2 roles hired; inference COGS starts scaling with real usage. |
| 3 Customer Creation | S&M program spend switches on; sales hires. | CAC payback inside target; NRR ≥ 100%; burn multiple < 2. | S&M program spend, AEs, marketing; usage and inference scale. |
| 4 Company Building | Build the org and platform; margin leverage appears. | Default-alive on the plan; second raise sized to 18–24 months. | Scale hires; platform/evals fixed costs step up. |
The timelines are programmable in the model (they can be adjusted); the baseline Customer Development timelines give a sense of where and when the cashflow will go positive. The kicker is that each gate needs to be hit first for that to be the case:
- There is no 'scaling' when Customer Discovery hasn't even happened.
- Even when pmf (product-market fit) is established, contribution margins must be above certain thresholds, which comes through Customer Validation of the business model
- Only then, does real Company Creation become possible, and that's the point where allocating large budgets to Sales and Marketing makes sense, typically on the back of a second fundraising round.
- From there, true and sustainable Company Building can occur, moving towards the goal of an eventual exit or IPO.
The New Sheet - Five AI Cost Lines to Estimate COGS and other Expense Items
(5_AI-API-Costs as reference)
The cost structure of the AI Stack can come across multiple different levers:
- L1 - Model Inference, LLM API calls in product - this is where the inference powers the product's own intelligence, and the company is billed for its API tokens usage on a metered basis
- L2 - Other third-party APIs - this is where the product is built on top of other products' APIs; the proliferation of AI coding has created both a API and MCP model, opening doors to all new types of product iterations powered by multiples API or MCP calls from third-parties
- L3 - Hosting and Cloud - depending on the provider and the nature of the app, this line item can range from being miniscule to being a major expense item
- L4 - AI dev tooling: Claude Code, Codex, etc. - developers and 'vibe coders' alike are taking advantage of coding agents to speed up development. Right now, most plans are in the $200 per person per month range (2026), but there is a large variance in enterprises where these tools are deployed with how much they spend per developer given the productivity and speed gains from these tools
- L5 - AI tools for non-engineering Staff - and inevitably, the business will likely leverage AI tools for places like customer support, marketing, and other non-technical functions
| Line item | Cost basis | Light | Medium | Heavy | Base-case selection |
|---|---|---|---|---|---|
| L1 Model inference, LLM API calls in product | % of revenue | 3–6% | 10–20% | 30–50% | Medium |
| L2 Other third-party APIs | % of revenue | 2–4% | 4–8% | 8–15% | Medium |
| L3 Hosting & cloud | % of revenue | 4–7% | 7–12% | 12–20% | Heavy |
| L4 AI dev tooling: Claude Code, Codex, etc. | % of engineering payroll | 3–6% | 6–12% | 12–20% | Heavy |
| L5 AI tools for non-engineering staff | % of non-engineering payroll | 1–2% | 2–4% | 4–8% | Light |
Each business will have a different profile of how and where they spend money on their AI Stack. What matters from a more macro perspective is the acknowledgement that the AI Stack is now a core part of the P&L and significantly cuts into margins compared to the SaaS era.
Some of these line items track to a % of revenue (such as L1), others are represented as a % of payroll (such as L4). Not everything is spent as an initial outlay like a typical subscription, most AI models are usage-based and scale up or down only with usage.
What's Next - Stress Testing & CPCT
Running through the model once myself as a proxy, it is extremely useful despite the added layers compared to a more typical model.
I am not releasing the model yet because it is still pretty primitive and untested in 'production.' The goal of this post was to lay out the thought process behind the model and areas of novelty compared to models of the past.
As an example of what the base case showed, for reference purposes:
On a $500K raise, base case cash bottoms around $43K in month 22 with only 1.5 months of estimated runway left, before going cash-flow positive in month 23
The genesis of the whole idea was prompting Claude to generate two financial models: one for a business model built on an AI-native stack, the other for a more traditional model that happens to leverage AI in certain areas. That's why the AI-API-Stack covers five different layers; leverage from AI clearly is not uniform in each and every business.
The problem with both Claude's original Excel models is that they were exceedingly complex. So I simplified it, synthesized the key parts, and spent several hours and days reverse-engineering the work. Claude built the first versions, I rebuilt them by hand - the structure and assumptions are mine.
The Thesis - Modelling out Agentic Business Models Will Be Extremely Useful in the Future
Since I have created many startup financial models in the past, the goal here was to template something I could theoretically use in the future to model out an AI-oriented business. That's the first dovetail from these models, and I haven't got to that point yet.
The second dovetail is relative to the CPCT (Cost Per Completed Task), specifically how to model agents - see Agentic Modelling, How Much Does it Cost to Run an Agent? for more context. As detailed on the homepage and throughout The Notebook, the goal here is to understand progressively how the business model of an agents works.
We have seen agents alone taking off, the latest example being Meta's release of Muse. Between the CPCT and its ability to measure real agent outputs against a workflow, and the AI Startup Financial Model, the ingredients are in place to understand how an agentic business model works, from end-to-end.
Thus if you happen to be reading this and are interested in testing the model or weighing in on what could make it better, get in touch.